Dashboard design that answers the question, not just shows the data.
Analytics dashboards, admin panels, and data-heavy interfaces designed for scanning, comparison, and decisions — with hierarchy that survives real data volume.
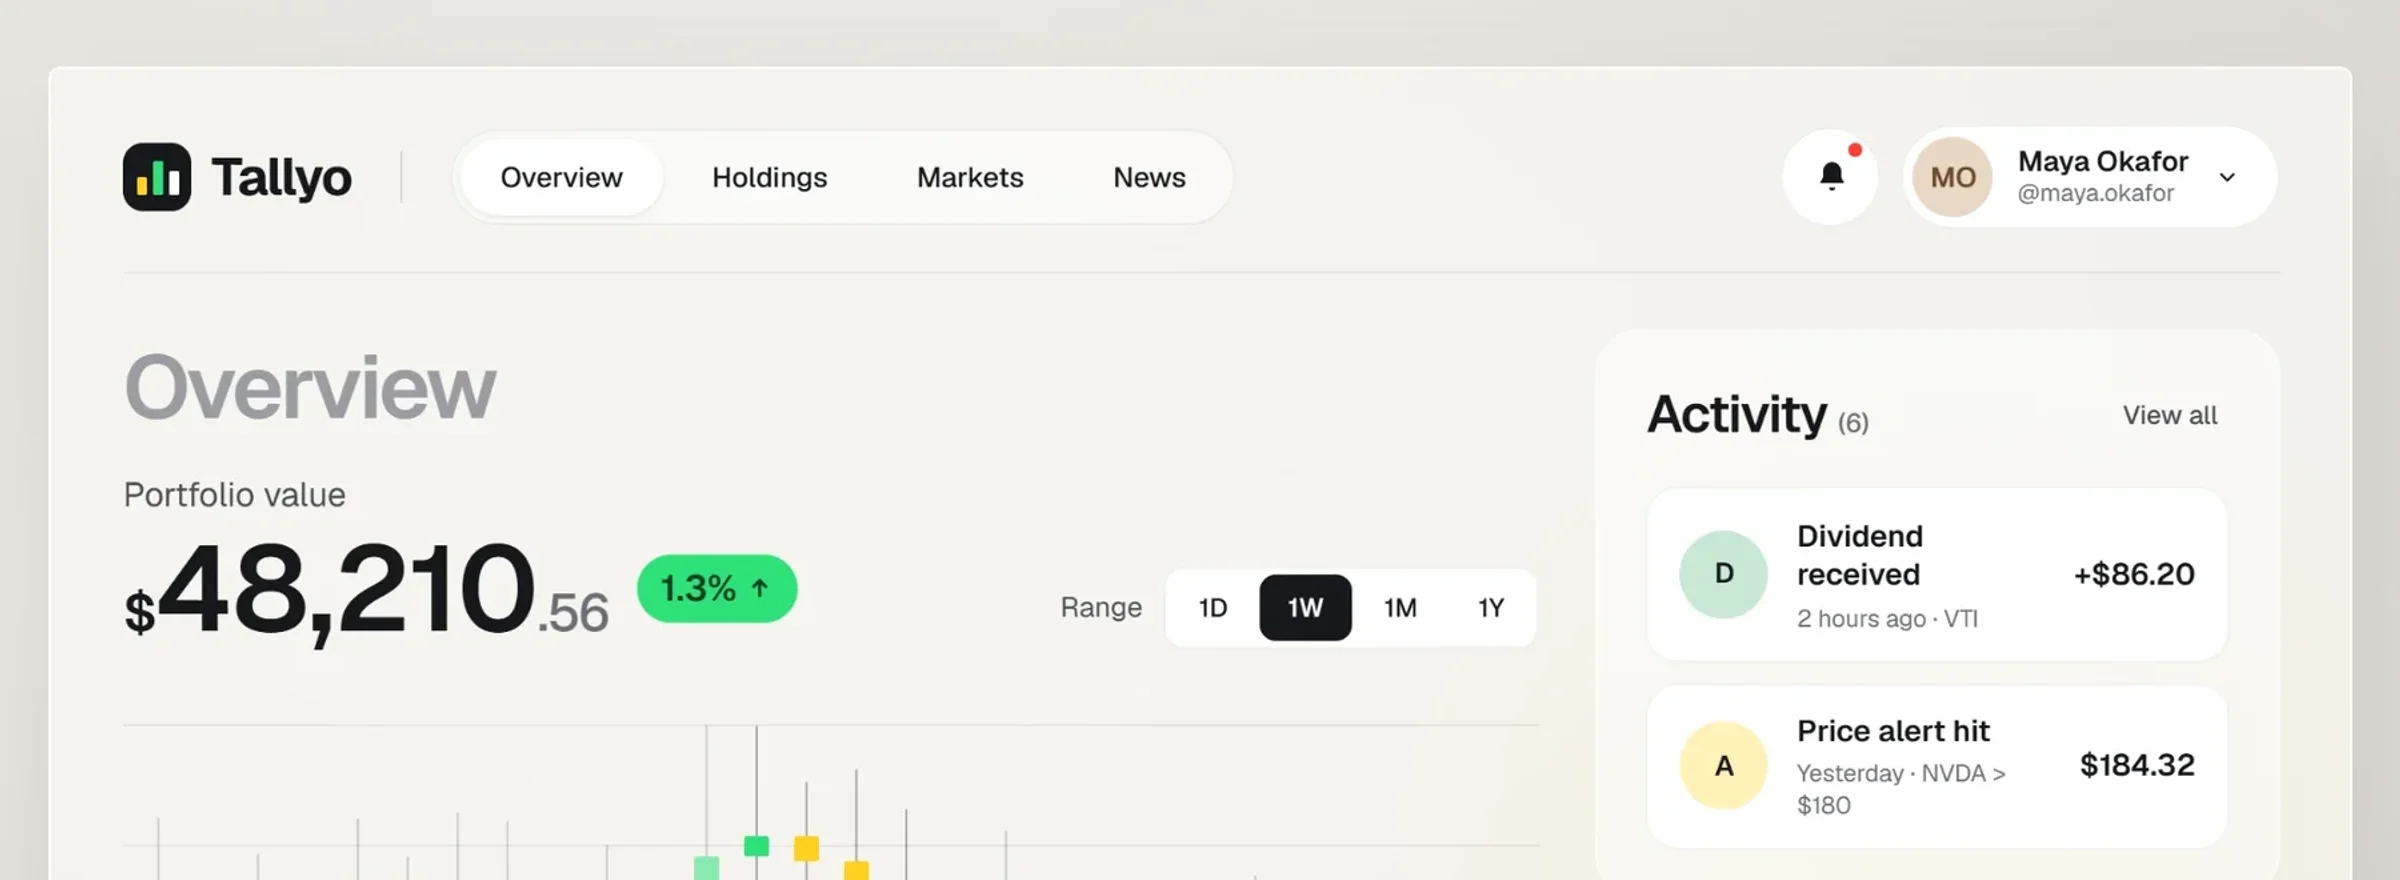
A dashboard isn't a wall of charts. It's an answer to a question someone asks every morning.
I design analytics dashboards, admin consoles, and data-dense product surfaces for fintech, SaaS, and AI platforms. That means choosing the right chart, ruthless hierarchy, readable density, and states for empty, partial, and overwhelming data — so users find the signal in seconds.
Where dashboards go wrong.
No hierarchy, so users can't tell what needs attention today.
The wrong visual encoding hides the pattern instead of revealing it.
Beautiful with demo numbers, unreadable with ten thousand rows.
Powerful controls buried where users never think to look.
Decide what belongs on the overview and what belongs one level down.
Chart selection and encoding matched to the question being asked.
Sorting, filtering, bulk actions, and density that handle real volume.
Back-office consoles designed with the same care as customer-facing UI.
Scheduled reports, shares, and exports that fit real reporting cycles.
Color scales that stay readable and pass contrast in both themes.
- Decisions firstList the questions each user role needs answered, in priority order.
- StructureLayout, hierarchy, and drill-down paths mapped to those questions.
- Visual designCharts, tables, and states designed against real or realistic data.
- Stress testValidate with edge-case volumes, empty states, and slow queries.
Make insight the product, not a byproduct of a chart library.
Give the team running your business an interface worth using.
Monitor usage, cost, and model behavior in one credible view.
Data UX from someone who reads the data model before drawing the chart.










The tools I design and build with, end to end.










Dashboards in daily use.
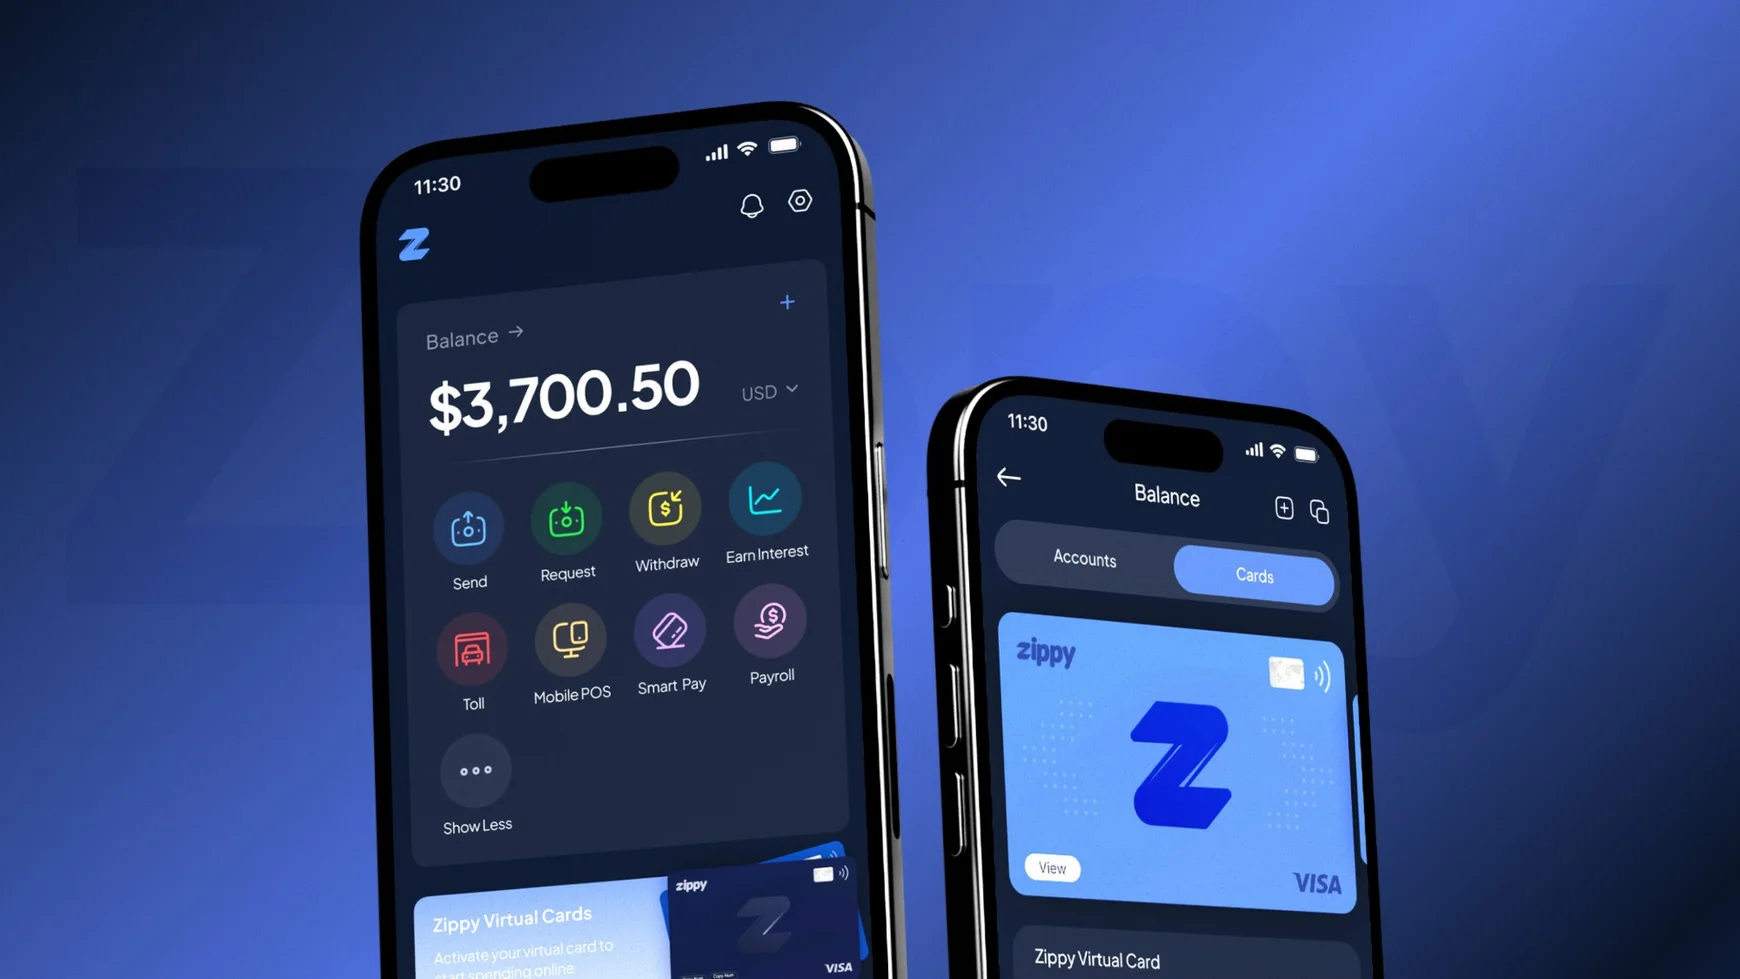
Zippy — tap. pay. zipped.
A multi-currency digital wallet that makes peer-to-peer payments, cards and balances feel effortless.
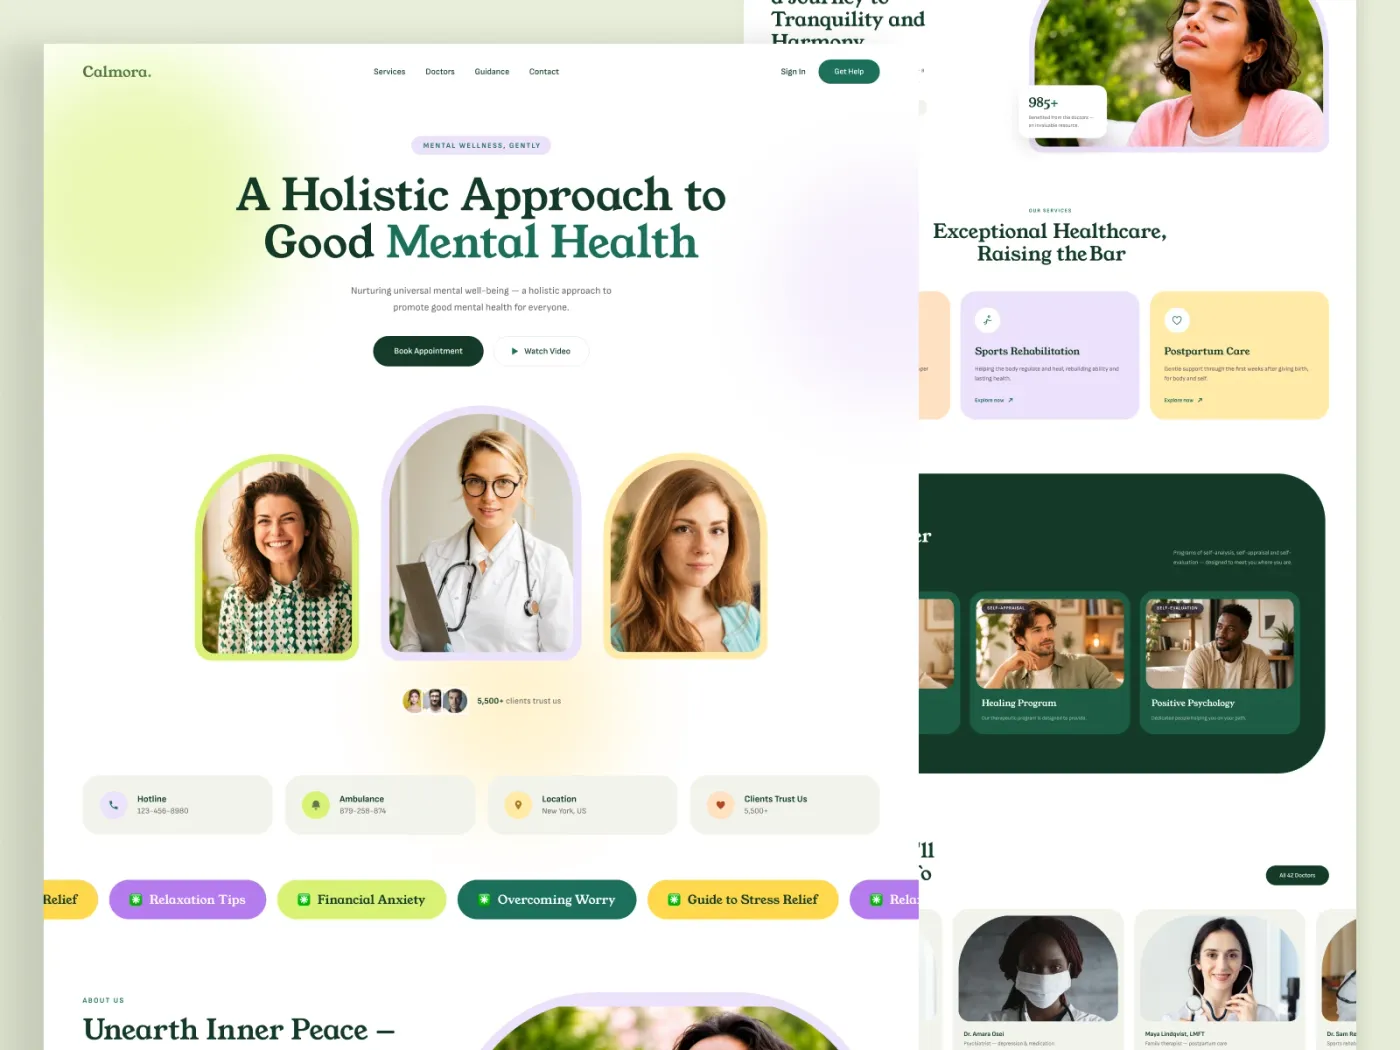
MediCare — patient booking made effortless
A mobile experience that turned a 9-step booking flow into three taps, for all ages and abilities.
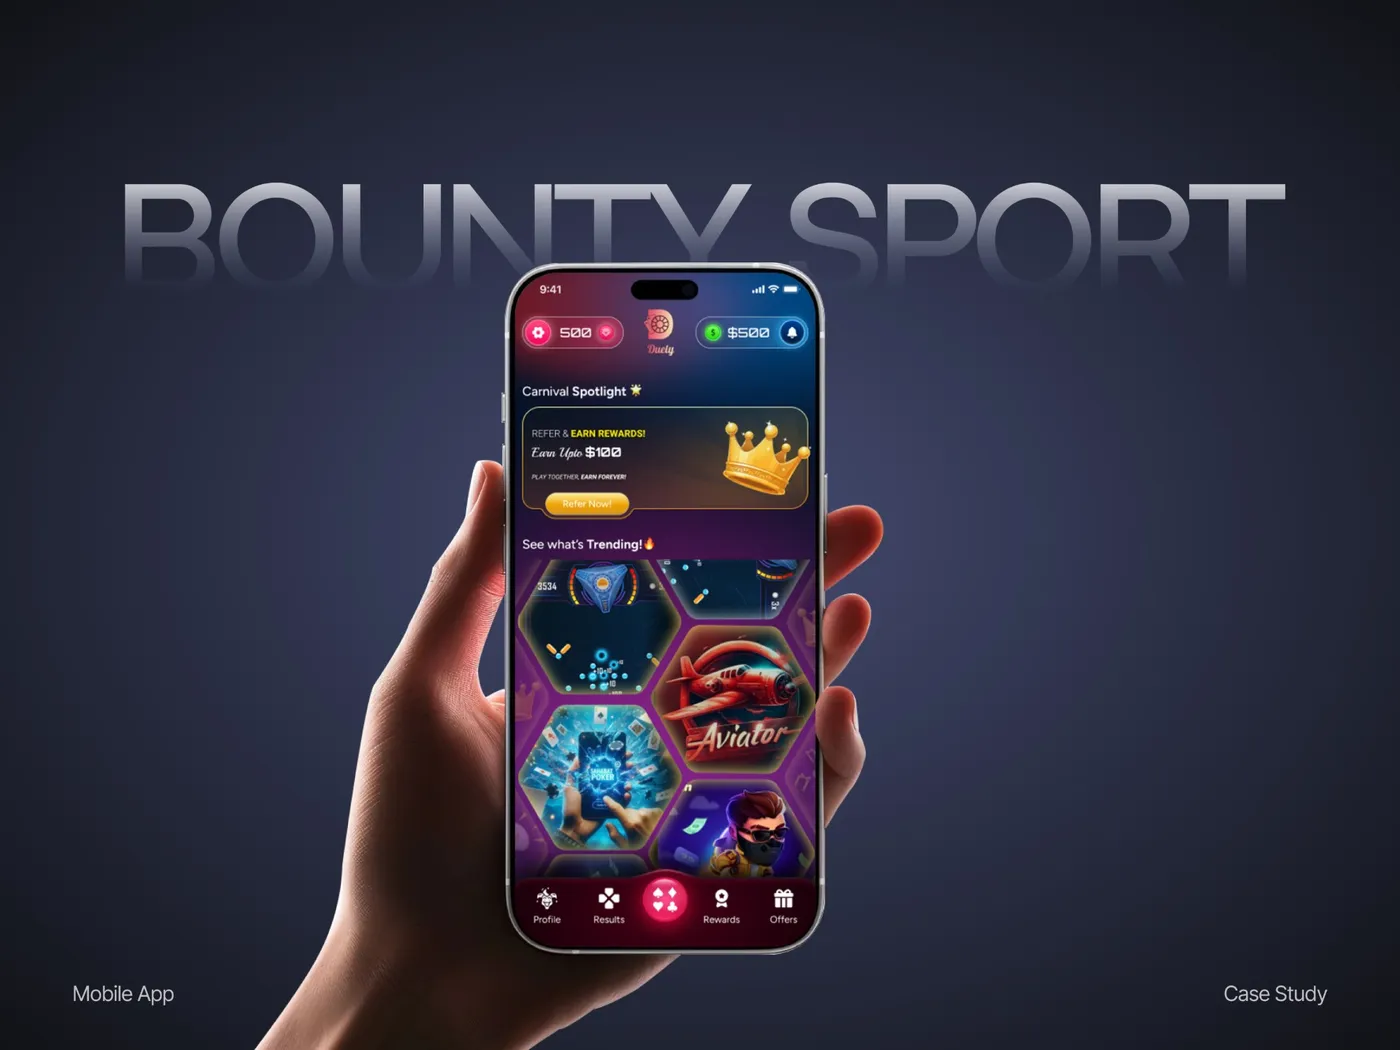
Shelfie — a storefront builder for small retailers
Simplified product listing and checkout so non-technical sellers could launch stores in an afternoon.
Wherever possible, yes. Real data exposes the density, edge cases, and outliers that demo numbers hide.
Yes. I design against the capabilities of your library — Recharts, ECharts, D3, or a vendor SDK — so what I deliver is buildable.
Yes, including data color scales that maintain contrast and category distinction in both themes.
By starting from the decisions each role makes daily. Anything that doesn't inform a decision moves to a drill-down.
Make the data usable.
Share your dashboard or your data questions — I'll show you what to cut and what to lead with.